Multi-Floor Elevator Simulation with AnyLogic
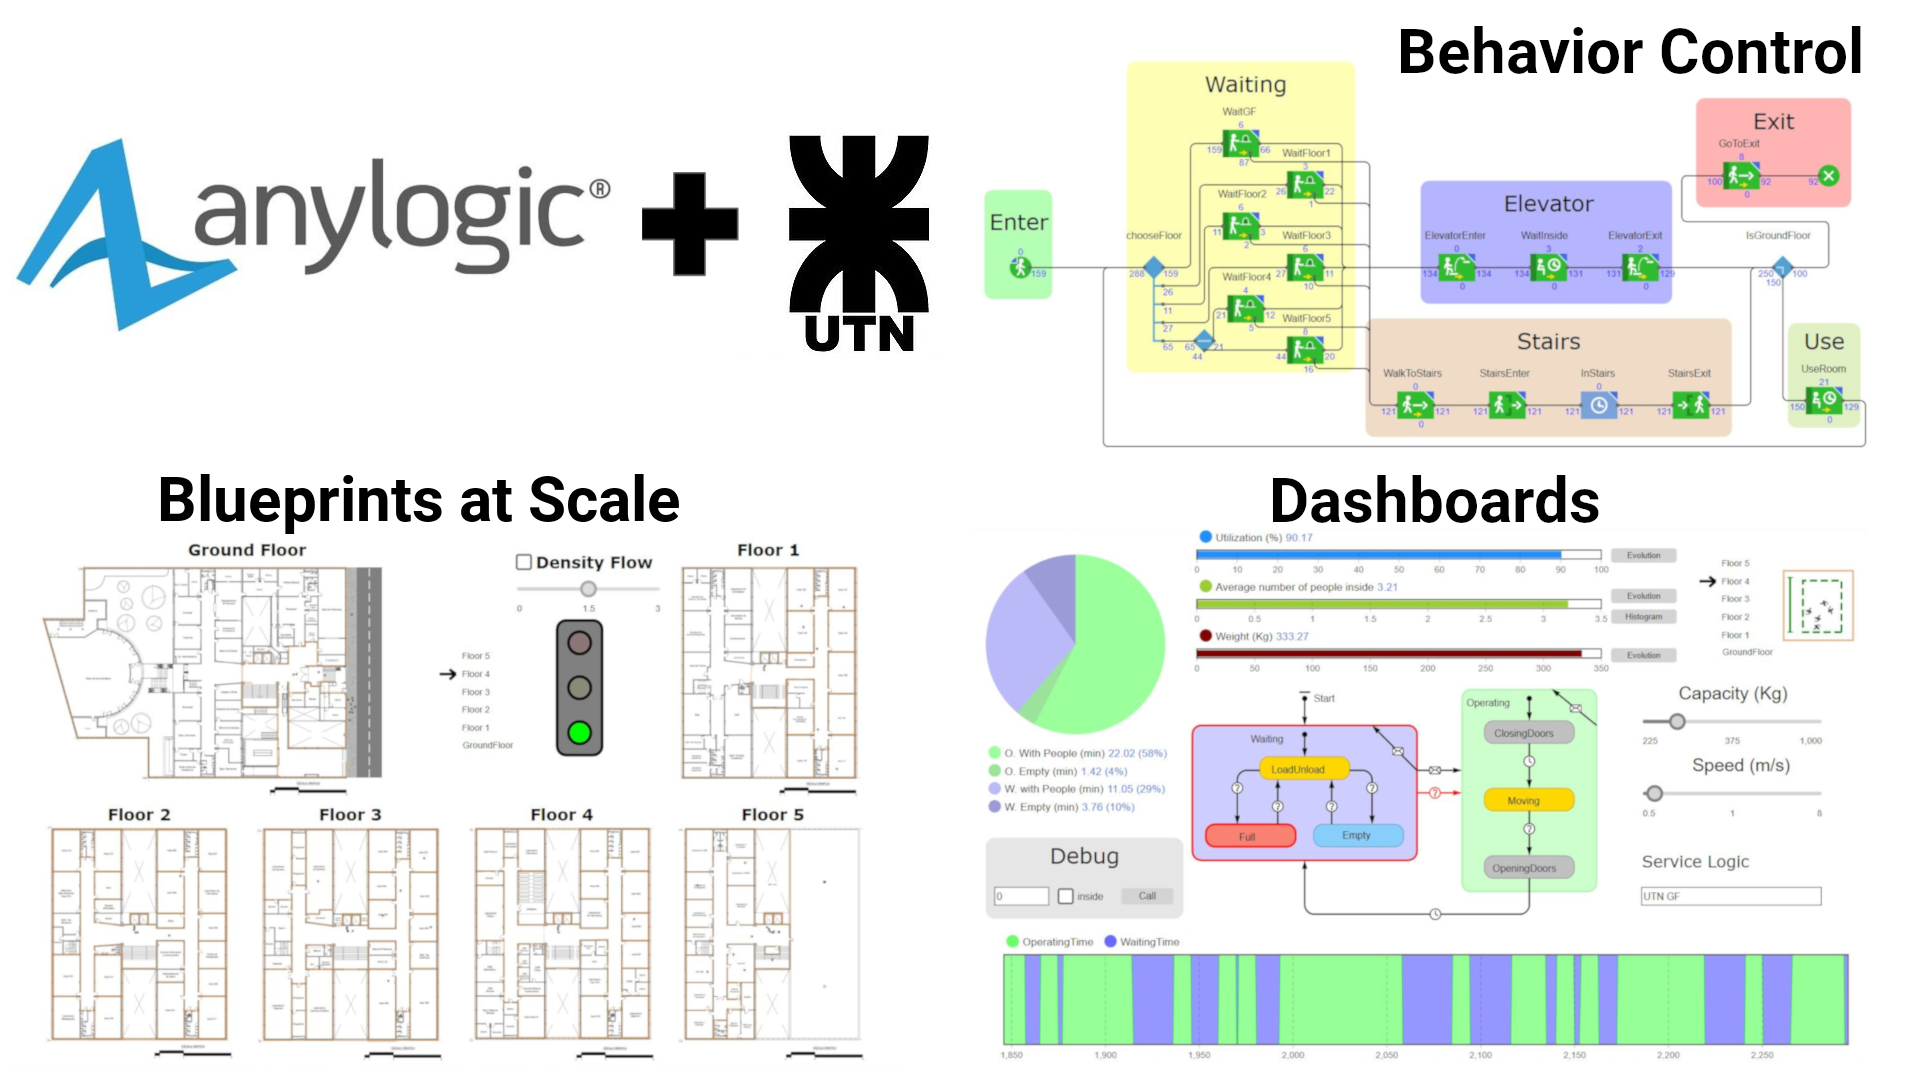
In my 4th year of University I had what would become one of my favorite courses, Simulation, where, as a final project, each student (or team of students) should choose a real problematic situation and create a simulation model (with AnyLogic). I choose something I was familiar with, the never-ending queue of the elevators of the University building, I asked for the blueprints and simulate several alternatives to find which was the best.
In case you never heard of what simulation is, don't worry, I will give you a quick introduction to this incredible world. For those who are already familiar with it, you can skip the introduction section or if you prefer, jump directly to the computational model
Introduction
Simulation is a way of problem-solving, it basically consists of translating a problem into a digital realm, make changes or test alternatives in this new environment and see the results. This information is later used for decision making. Saving loads of money, time and manpower.
Why is this necessary or useful?
Many processes can't be stopped or delayed, industries, for example, can just stop producing in order to test alternatives that might result in terrible outcomes! For this reason, it is safer, cheaper and much more convenient to use simulation.
What are the advantages?
Simulation Software Companies usually compare simulation with working with spreadsheets (such as Excel) in order to make decision and, although spreadsheets are really useful for some problems, when it comes to testing alternatives of the real world, a dynamic, interactive and more visual approach is preferred, especially when talking to non-technical people, who probably will be the ones making the final decision.
Another point is that Simulation Software relies (in most cases) on random number generators and thus the outcome of this software tends to be much similar to the real world. As opposed to the general analytical and "ideal" approach one takes when using spreadsheets.
How can be done?
Simulation software exists, both commercial and open-source and when a graphic user interface (GUI) is not needed, even some programming languages may be used with some additional libraries. In this article, I'll be talking about AnyLogic, a commercial software which has a free student license.
Context
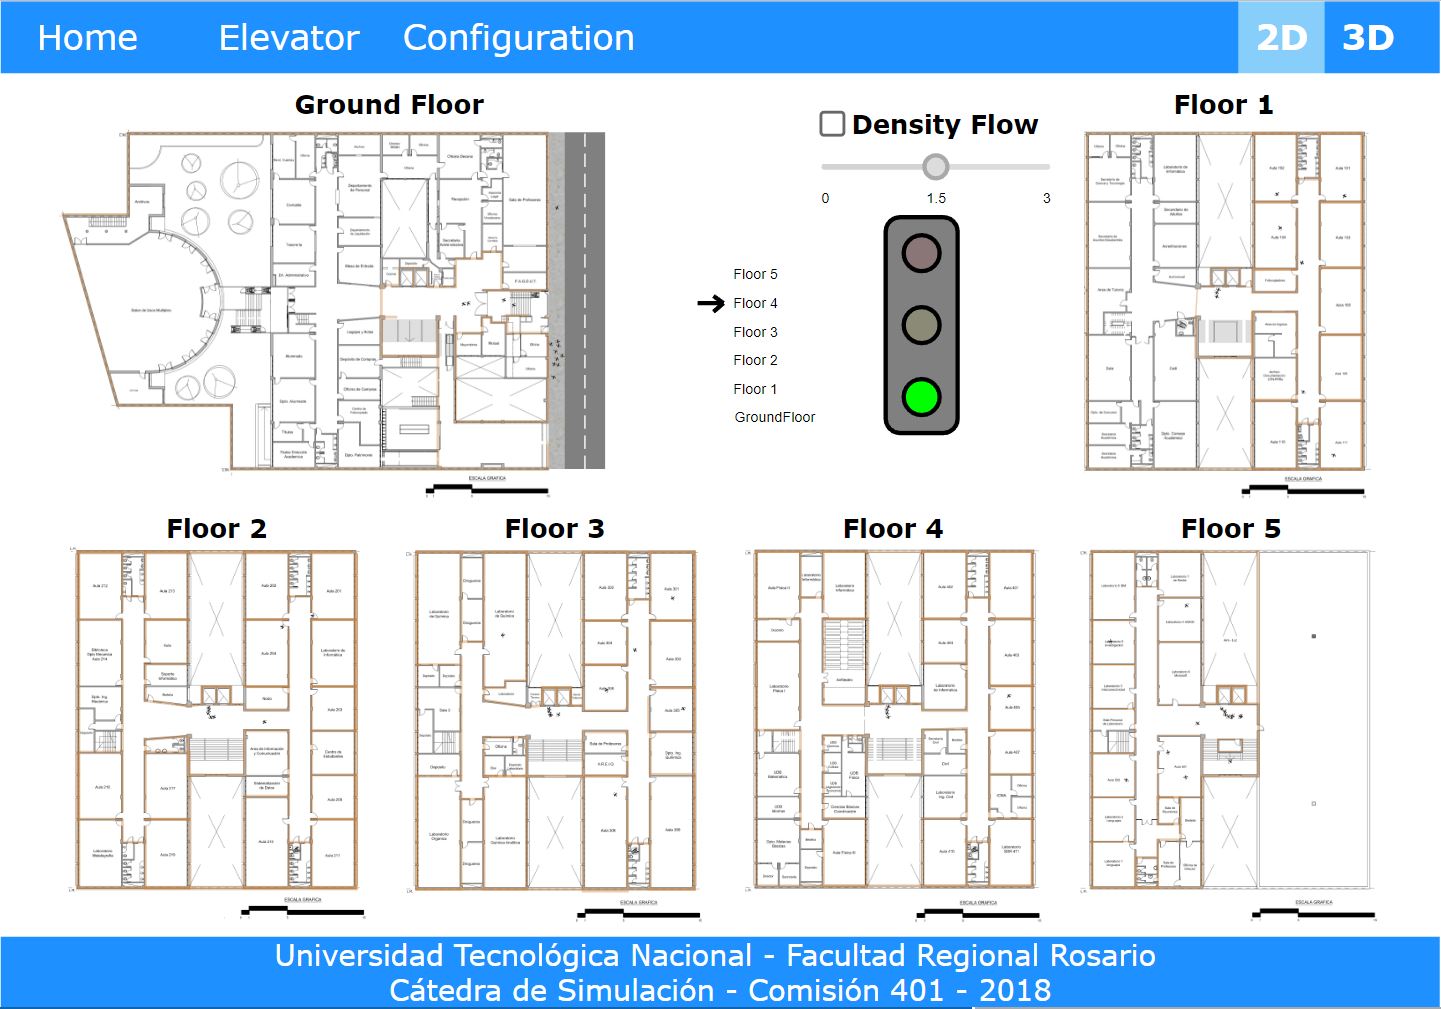
I study at the "Universidad Tecnológica Nacional (UTN)" also translated as (National Technological University), it has several buildings but the biggest is the main one. There are 5 different departments, Mechanical Engineering, Chemistry Engineering, Electric Engineering, Civil Engineering, and Information Systems Engineering, each department has its own floor. The building has 5 floors and one underground level. The building is old, preserving the really high ceilings and the long stairs common in the time of construction, making the elevators a must. There are two elevators but only one goes to the fourth and fifth floor.
To better represent the distribution, the blueprints were used (with permission):

Problem
The university has approximately 1000 students (first year aside), and for two elevators in the rush hour, it is natural to think that long queues will form. In my fourth year, I had the chance to experiment and try to fix this situation, most people believe that the long queues are due to the internal logic of the elevator so I thought, what if we change that? As a result, with another two classmates, we decided to test several alternatives.
But before trying new alternatives, we had to identify how to the elevator is working now.
Right now, when the elevator is moving up, it stops in the floors requested from inside, when is moving down, it stops in the floors requested from both inside and outside (This is called Actual in our model).
This information was obtained via experimentation since there was no manual available to get the information from.
Alternatives
The alternatives we first thought was FIFO (First in, First Out), we knew it would be awful but it's a good way to determine what the worst non-cyclic is like (Cycles are really bad since it could produce infinite loops). So in order to test how good the other alternatives are we chose FIFO to represent the worst possible solution. The other alternatives are as follows:
- Alternative 1 (ALT 1): The same as Actual but, when is lazy, it goes to Ground Floor.
- Alternative 2 (ALT 2): The elevator stops in the floors requested from both inside and outside when moving either up or down
- Alternative 3 (ALT 3): The same as ALT 2 but, when is lazy, it goes to Ground Floor.
Simplifications
Before diving into the model itself, some simplifications must be stated:
- The population of interest is the students, so teachers and administration staff are not taken into account
- When a student goes to the ground floor, we assume they leave the university, since there is nothing they can do there. All the offices on the ground floor are for the University staff.
- The simulation only involves one of the two elevators, to get a simpler model
- The simulation doesn't cover the underground floor for two reasons: 1. The chosen elevator can't go there and 2. The number of people going to that floor is very low.
Students behavior
Each student has a particular behavior and it is important to model it correctly, the following are a simplified and a detailed version of this behavior.
Simplified
The student goes into the university, enters a specific classroom and stays there for a certain amount of time and then leaves.
Detailed
The actual behavior is a bit more complex:
- Every student enters the building in the Ground Floor (GF)
- The students go from the GF to another floor and vice versa. It is rarely that a student travels from a floor different from GF to another floor since all the activities usually are covered in one or more classrooms on the same floor. This behavior exists but it is considered as not significant.
- Students tend to tolerate longer waits when going to the GF and when going from the GF their tolerance is much lower.
All of the previous allow us to introduce a more specific problem: The GF queue. The main objective of the simulation will be reducing as much as possible both the length of the queue and the waiting time of the GF since this is the scenario where there is the lowest tolerance.
It is also necessary to mention that since the tolerance is too low, an auxiliary system should be modeled too since many of the users will "abandon" the queue and use the stairs instead.
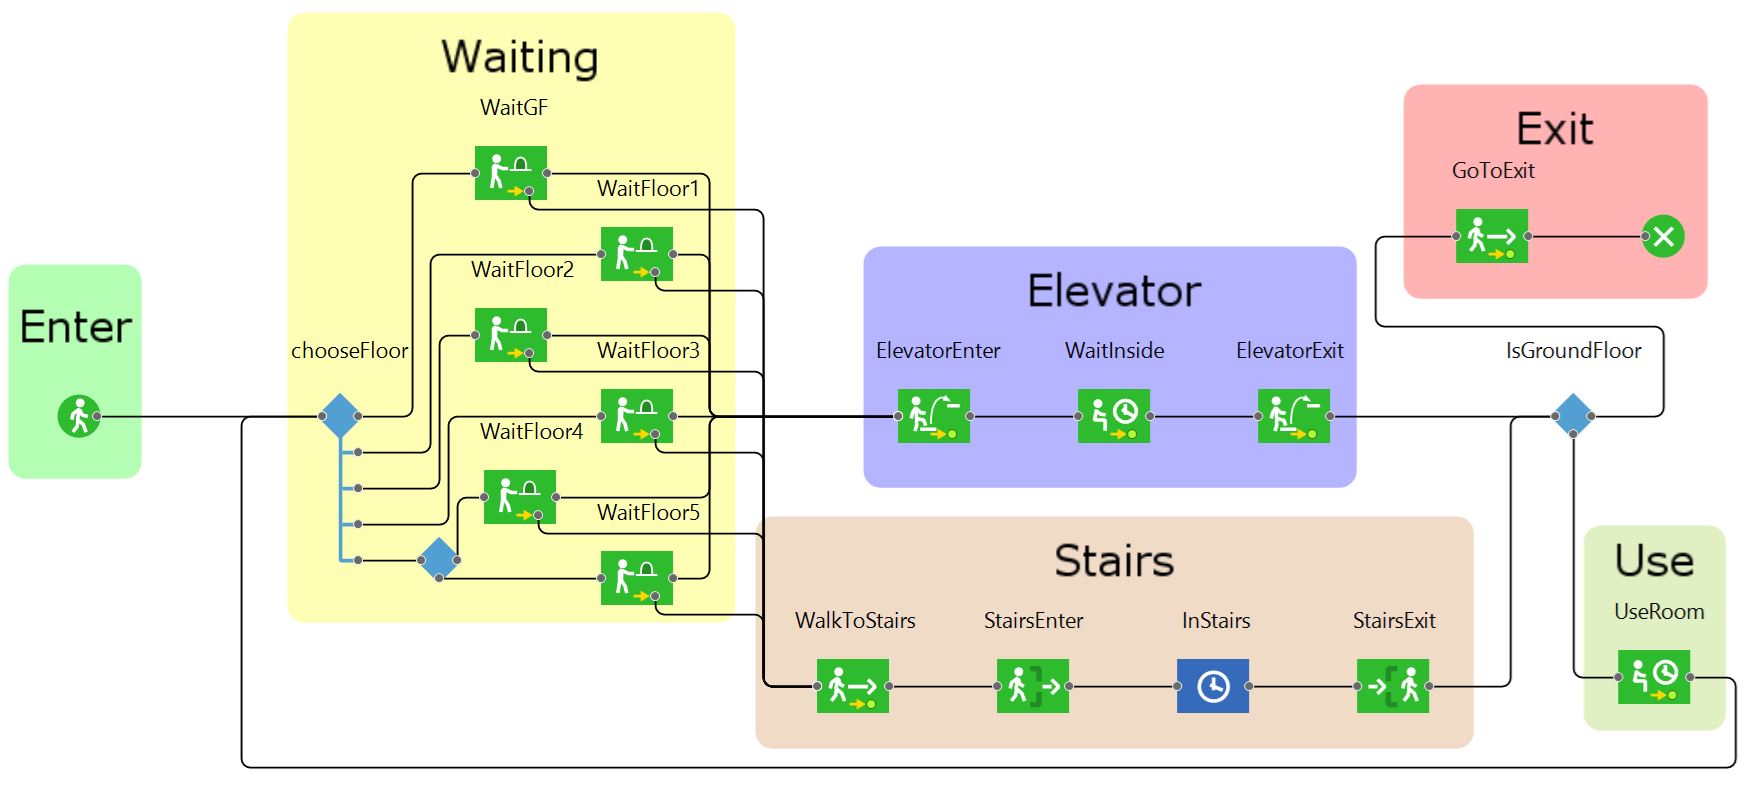
The behavior of the students is represented in the following diagram:
Model
There are different types of simulation but for this particular situation, we choose "Agent-Based", since it is natural to think the elevators and the students as two agents interacting with each other.
When talking about Agents and how they interact, a tool called "State Machines" is used. This artifact models the possible "states" of a particular agent and "transitions" which are how the agent goes from one state to the other
State Machines are defined in the UML standard but in this case, a modified version will be used, this version is the one that AnyLogic uses. And in the software, there are 3 types of transitions:
- By Delay: The transition occurs automatically after a certain delay.
- By Condition: The transition occurs whenever a certain condition is true.
- By Message: The transition occurs when the agent receives a specific message from an agent.
Global Conditions
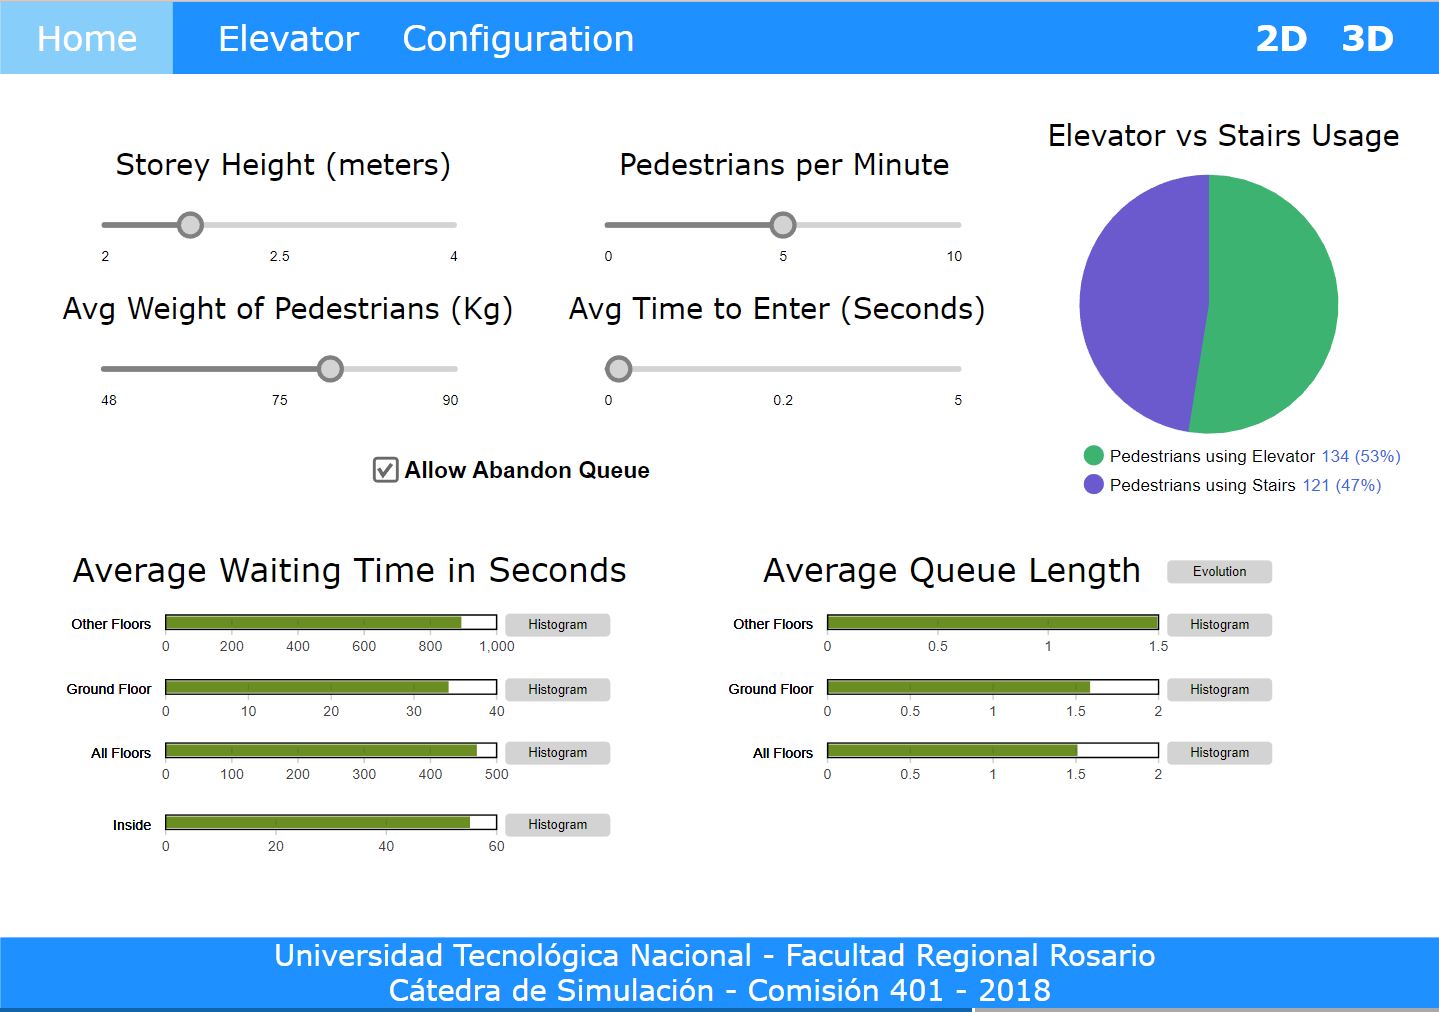
In addition to the two main agents, there are global variables that affect the whole simulation such as:
- Storey Height: It includes the height from the floor to the ceiling and the thickness of the ceiling.
- Average Students per minute: the arrival frequency of the students to the system.
- Average Mass of students (Kg): The average mass of the students, as a first approximation a triangular distribution is used to estimate the weights.
- Average time to enter into the elevator (s): it is the time each person takes to enter the elevator, it is a small amount but it can accumulate when there are lots of people in the queue.
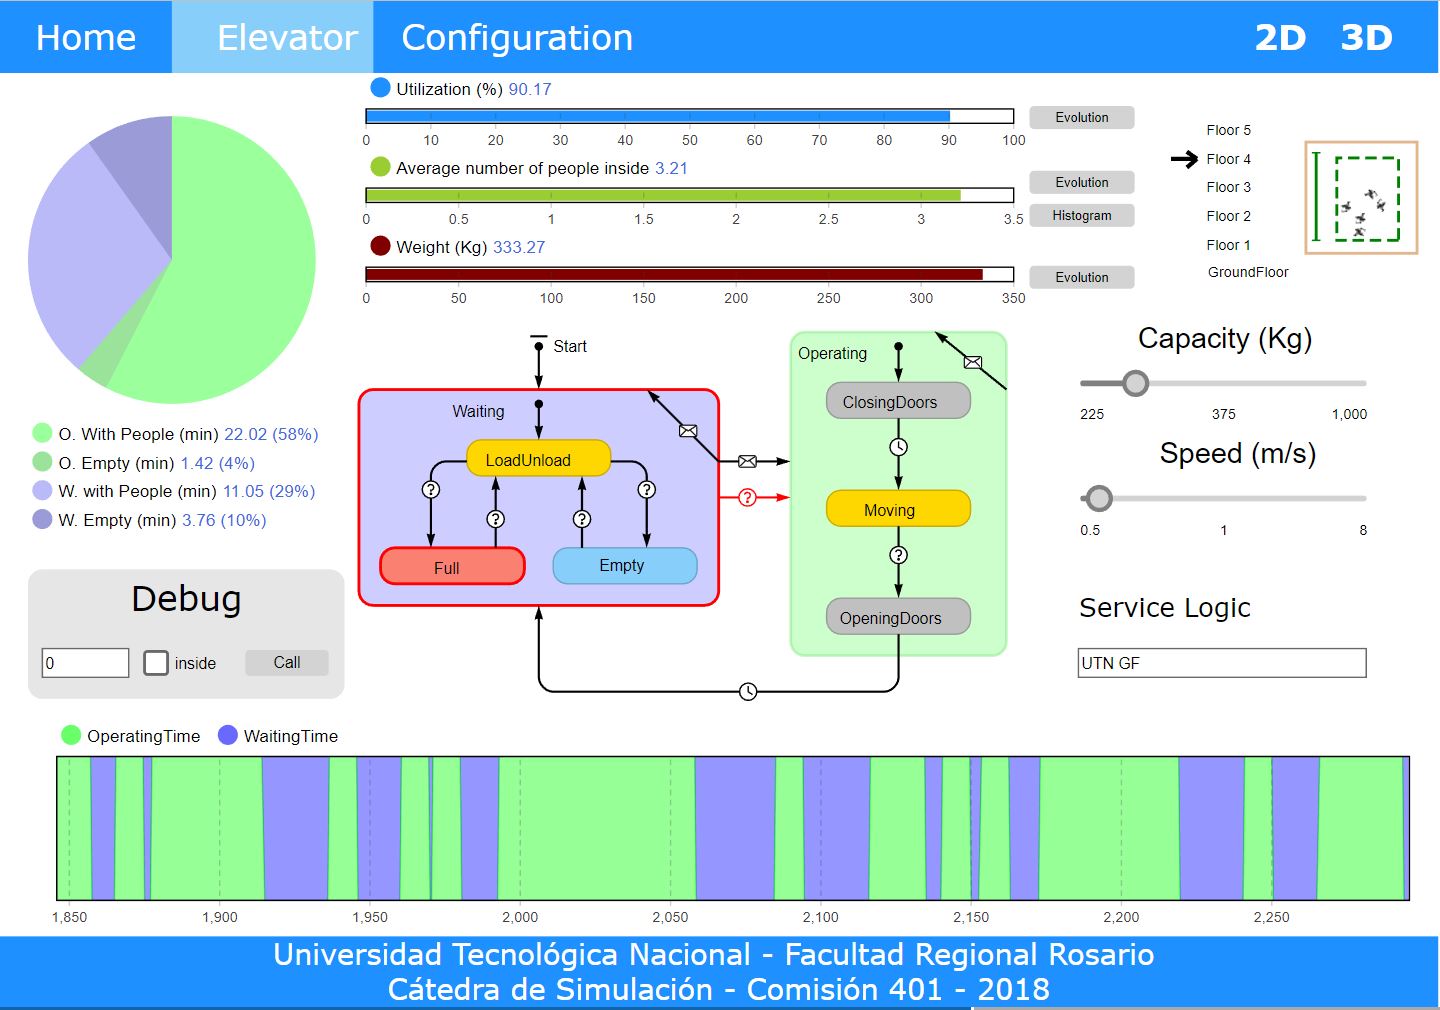
Elevator Agent
On the other hand, the elevator also has its own variables, these variables can be changed any time during the simulation but when doing an experiment, they should be set once at the beginning and kept fixed.
- Capacity (Kg): Maximum capacity for the elevator, it is approximately 5 people (75Kg each) as default.
- Speed (m/s): Speed at which the elevator moves
- Service Policy: Determines how the Requests should be served. This is the main variable since it is where the alternatives should take effect.
- Number of users inside: The number of people inside
- Requests list: Collection of requests in the order they were received, used by the service policy to determine which is the next.
- Actual Floor: Floor the elevator is in at the moment.
- Destination Floor: Floor of the currently served Request.
The state machine of this agent is the following:
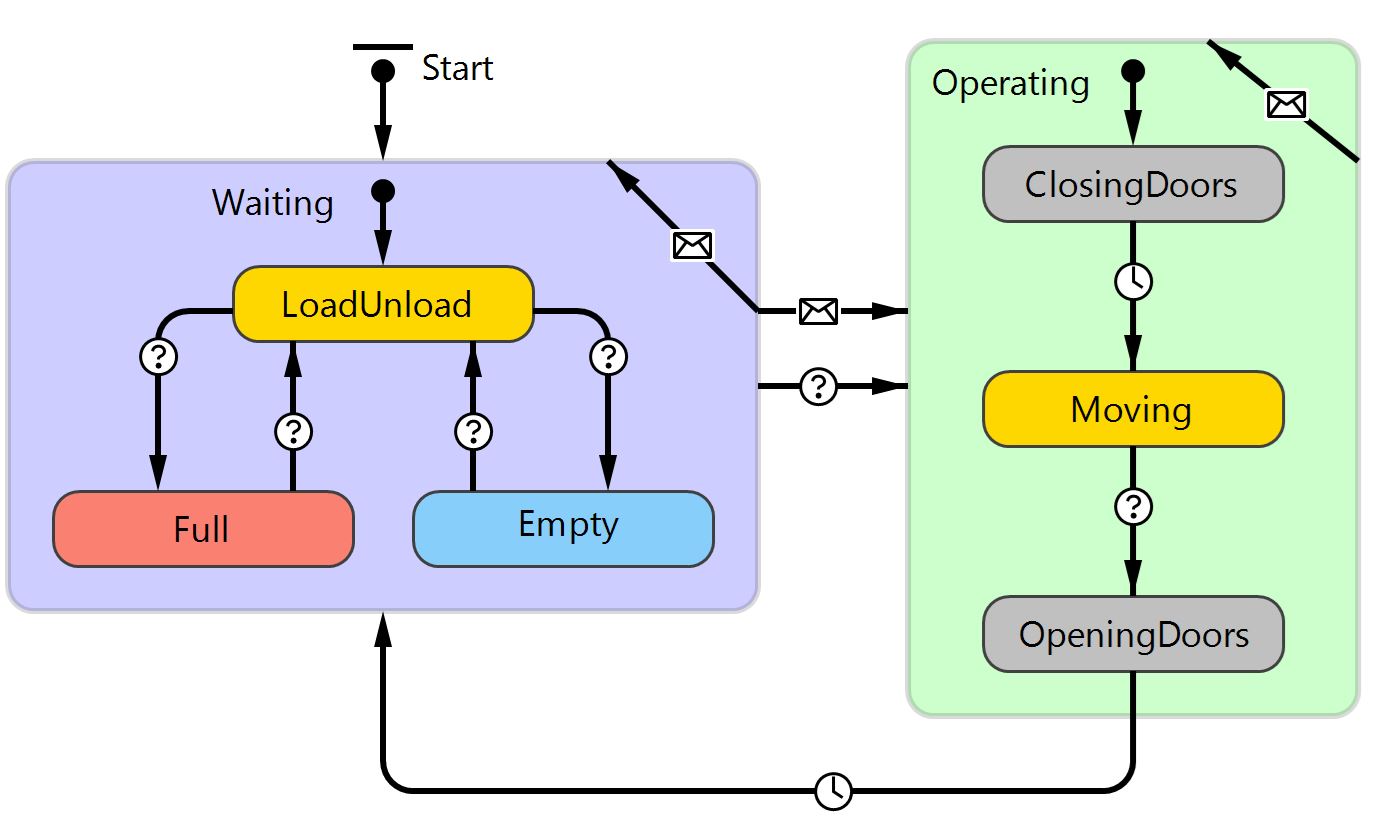
Where there are two main states:
- Waiting: The elevator is stopped at a certain floor, it could be loading/unloading people, empty or full.
- Operating: The Elevator starts moving until reaching the destination floor, there is a delay to open and close the doors.
Student Agent
The student agent is a bit different since there are loads of student so it has more random particularities.
The variables of this agent are:
- Time to enter the elevator (s): Each person takes a different amount of time to enter the elevator.
- Mass (Kg): body mass of the student, determined using a triangular distribution
- Probability of using the stairs: Each user as a particular desire to use the stairs, whether it being because the queue is too long, they have already waited for too much or personal preference. This probability is inversely proportional to the number of the floor the student should go.
- Speed (m/s): Each student has a particular speed, which affects their speed while using the stairs, the speed of going upstairs and downstairs are different but both proportional to the average speed of the person.
- Tolerance to the waits (s): Maximum amount of time the student is willing to wait in the queue, if it is exceeded, they will abandon the queue and use the stairs.
- Actual Floor: Floor the student is at the moment.
- Destination Floor: Floor the student is willing to go.
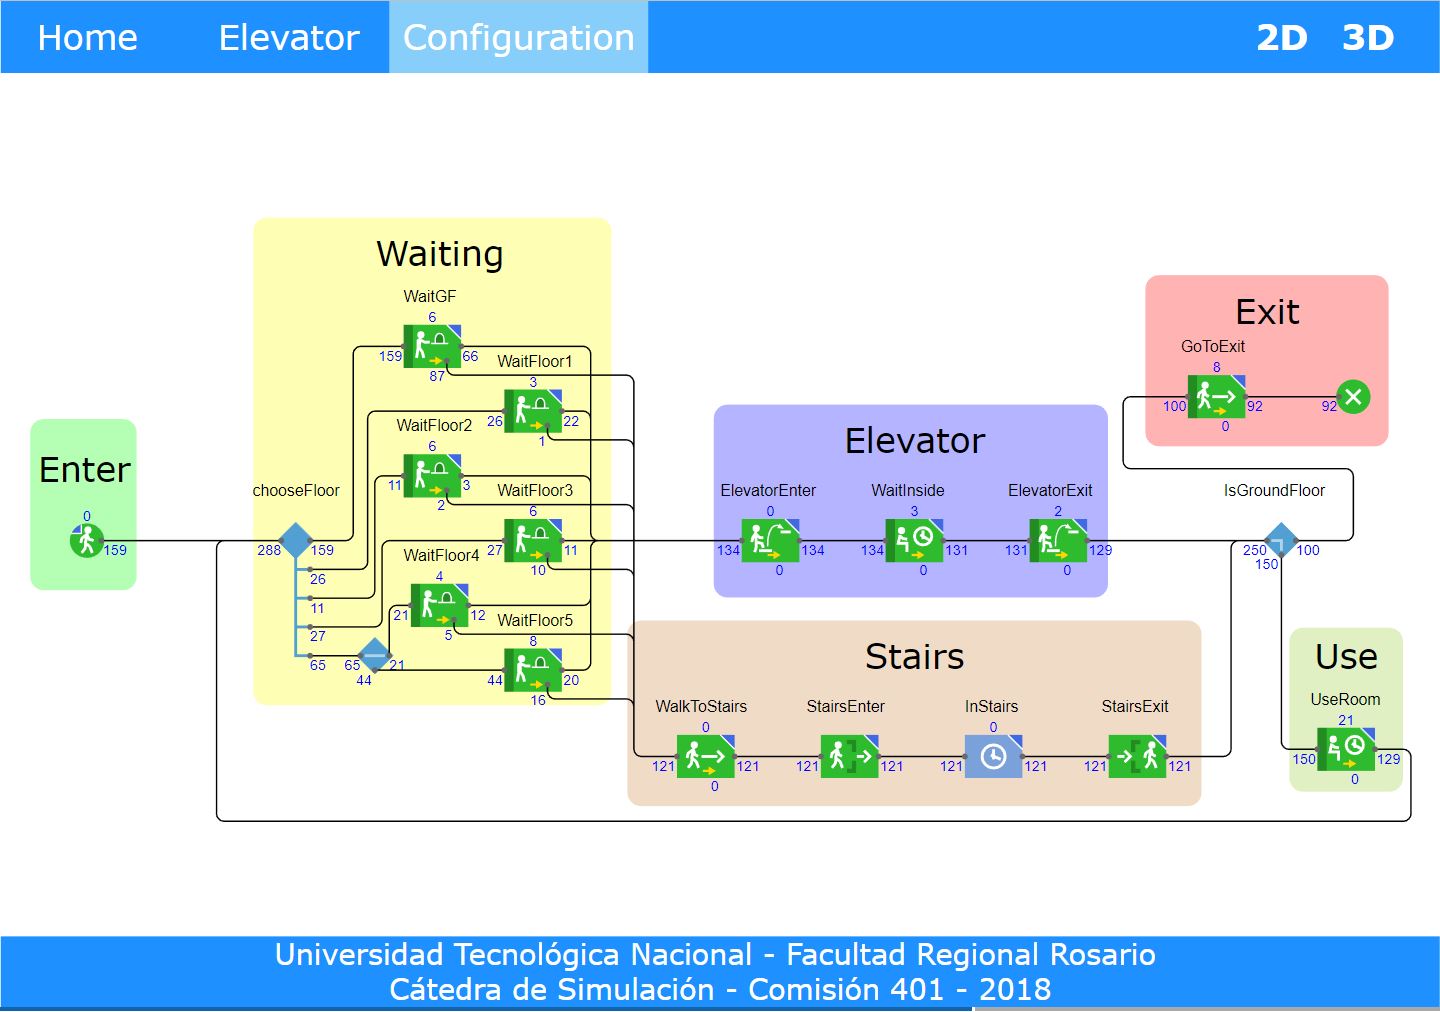
The state machine of the students is the following:
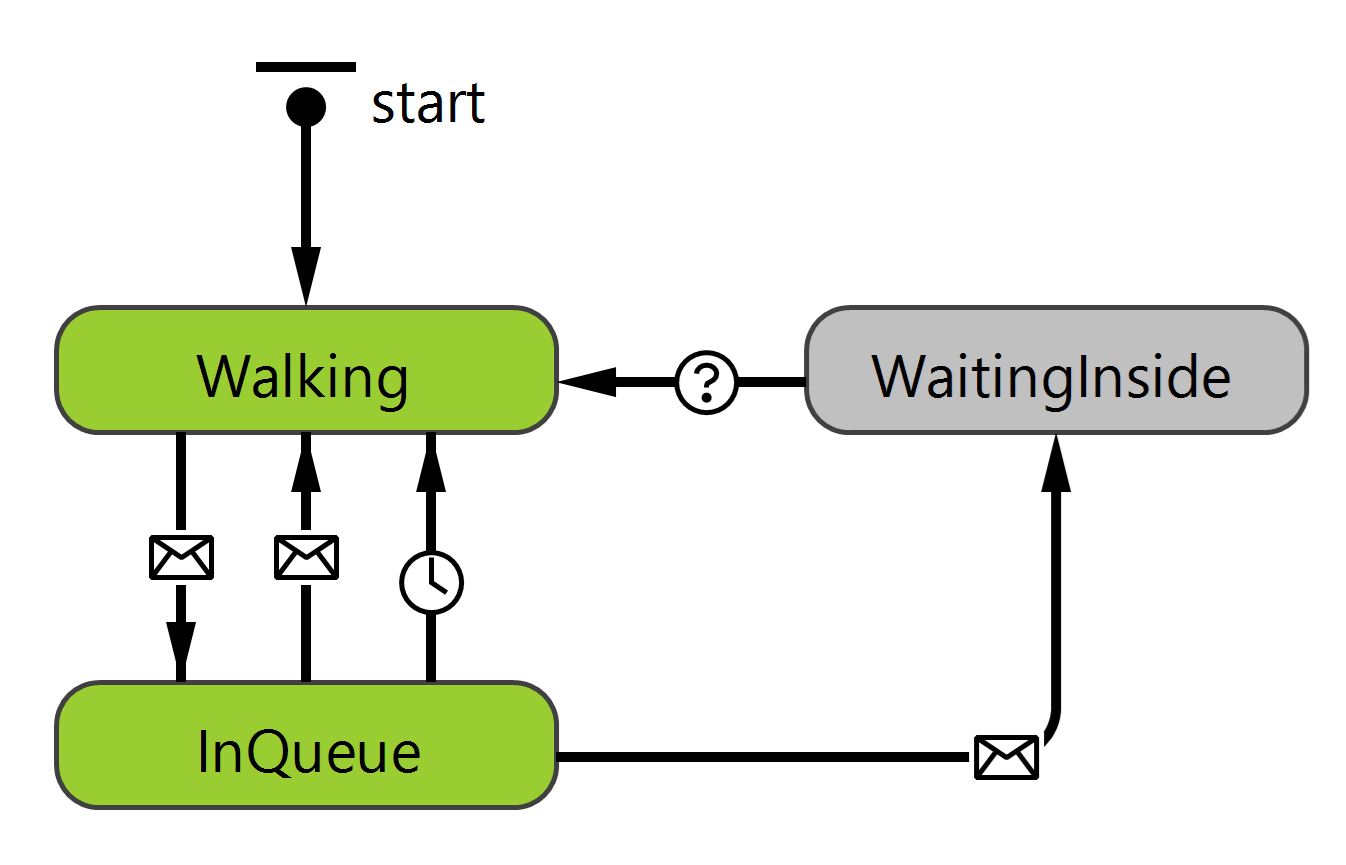
Each student has 3 possible states:
- Walking: When the user is neither inside the elevator or waiting in a queue
- InQueue: When the user is waiting in a queue
- WaitingInside: When the user is inside the elevator
The Experiment
Once everything is set up in the software, a set of experiments are run and then statistical methods are used to determine which alternative is the best (with a certain level of confidence). This post was more of the "theory" behind the model but to really understand how it works I recommend you to play with the demo available in the next section.
Among the five alternatives, it was necessary to identify which were the worsts, so both the average length and the average waiting time were calculated, each with its confidence interval. Resulting in the following:
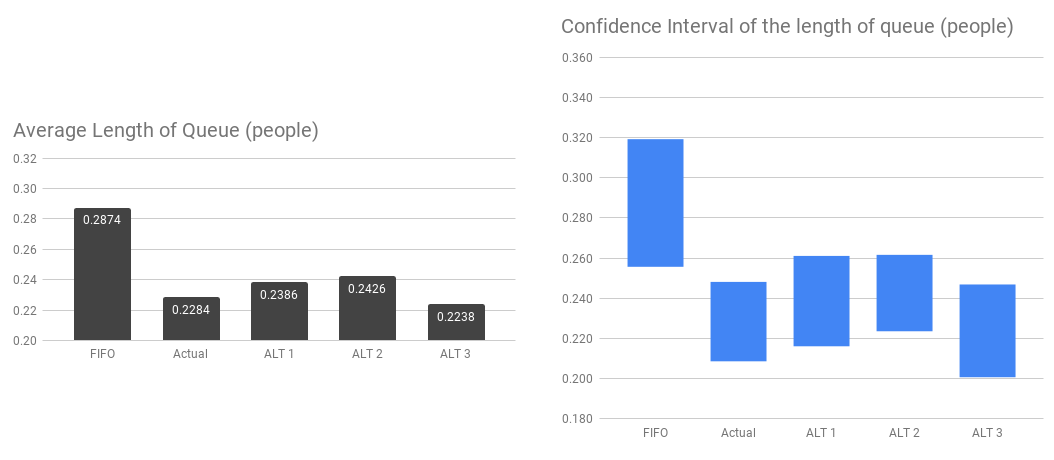
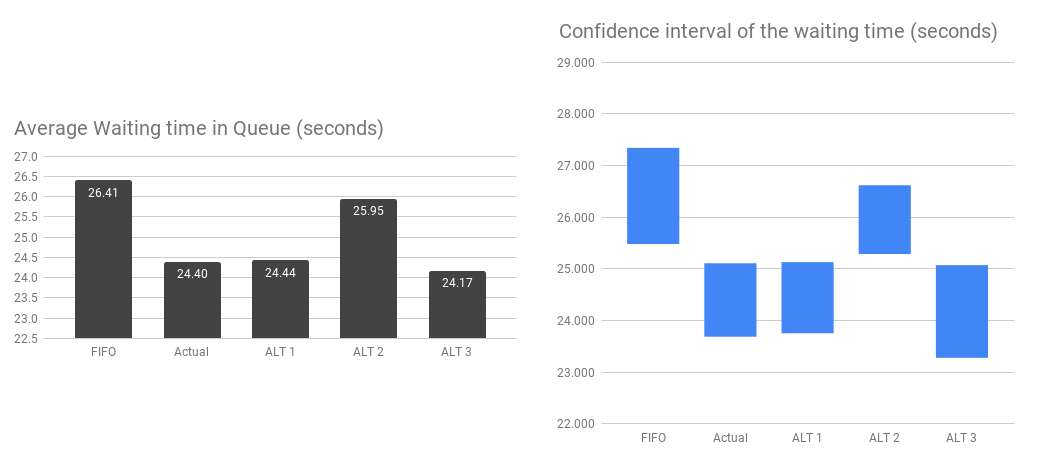
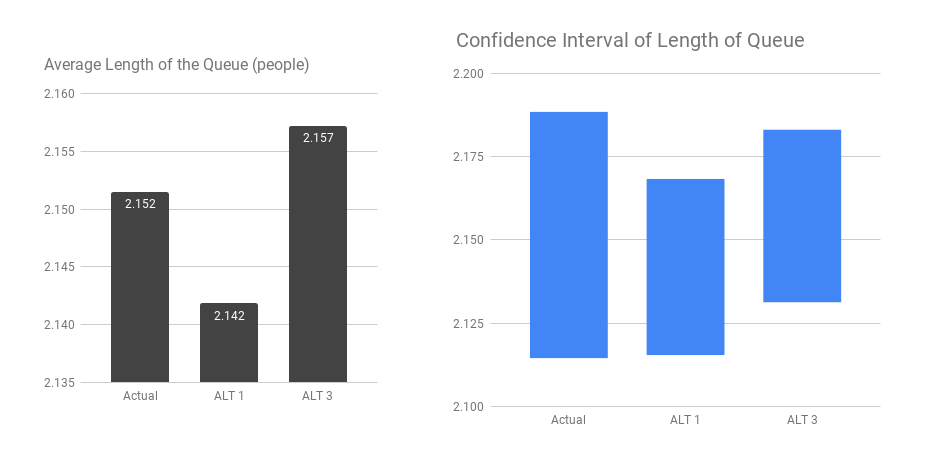
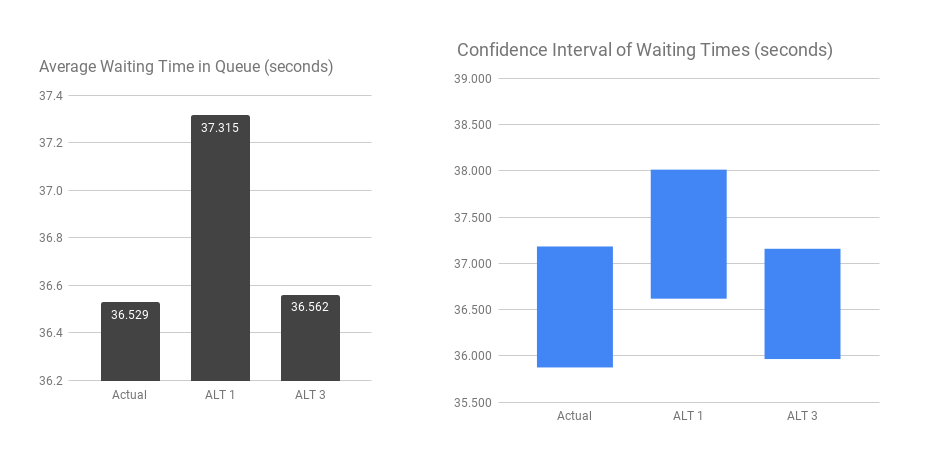
Looking at the confidence interval of the waiting time, it is evident that FIFO and ALT2 were the worst and the other 3 options are quite similar. That's why Ranking and Selection was used to discern which was the best, increasing the sample size and the final result was the following (now the % of people leaving the queue is added):

Demo
This is the final result, the initial menu is in Spanish but the rest of the GUI is in English. In case you can't run it you can go to the screenshots section to see how it looks like and then run the model from a PC.
Also, you can embed this simulation in your website with the following snippet
<iframe src="https://elc.github.io/blog/iframes/elevator-simulation/simulation-anylogic-iframe.html"></iframe>
Conclusion
Although the results were contrary to the expected, it is worth mentioning that there are some limitations to take into consideration, which may vary the final result such as:
- The university as an underground floor which wasn't modeled
- The second elevator wasn't modeled
- The electrical consumption of the alternatives is not considered
- The speed of the elevator is considered constant
These limitations would result in a much more complex model but yield more accurate results. Also, notice that in this simulation the economical variable wasn't considered since it is tightly related to the electrical consumption.
Quote and citation
If you want to receive the source files of the model and/or quote this work, please feel free to send me an email at castanoezequielleonardo@gmail.com
Screenshots
The following are some screenshots of the running model
Main Screen
Elevator Control Panel
Student Behavior
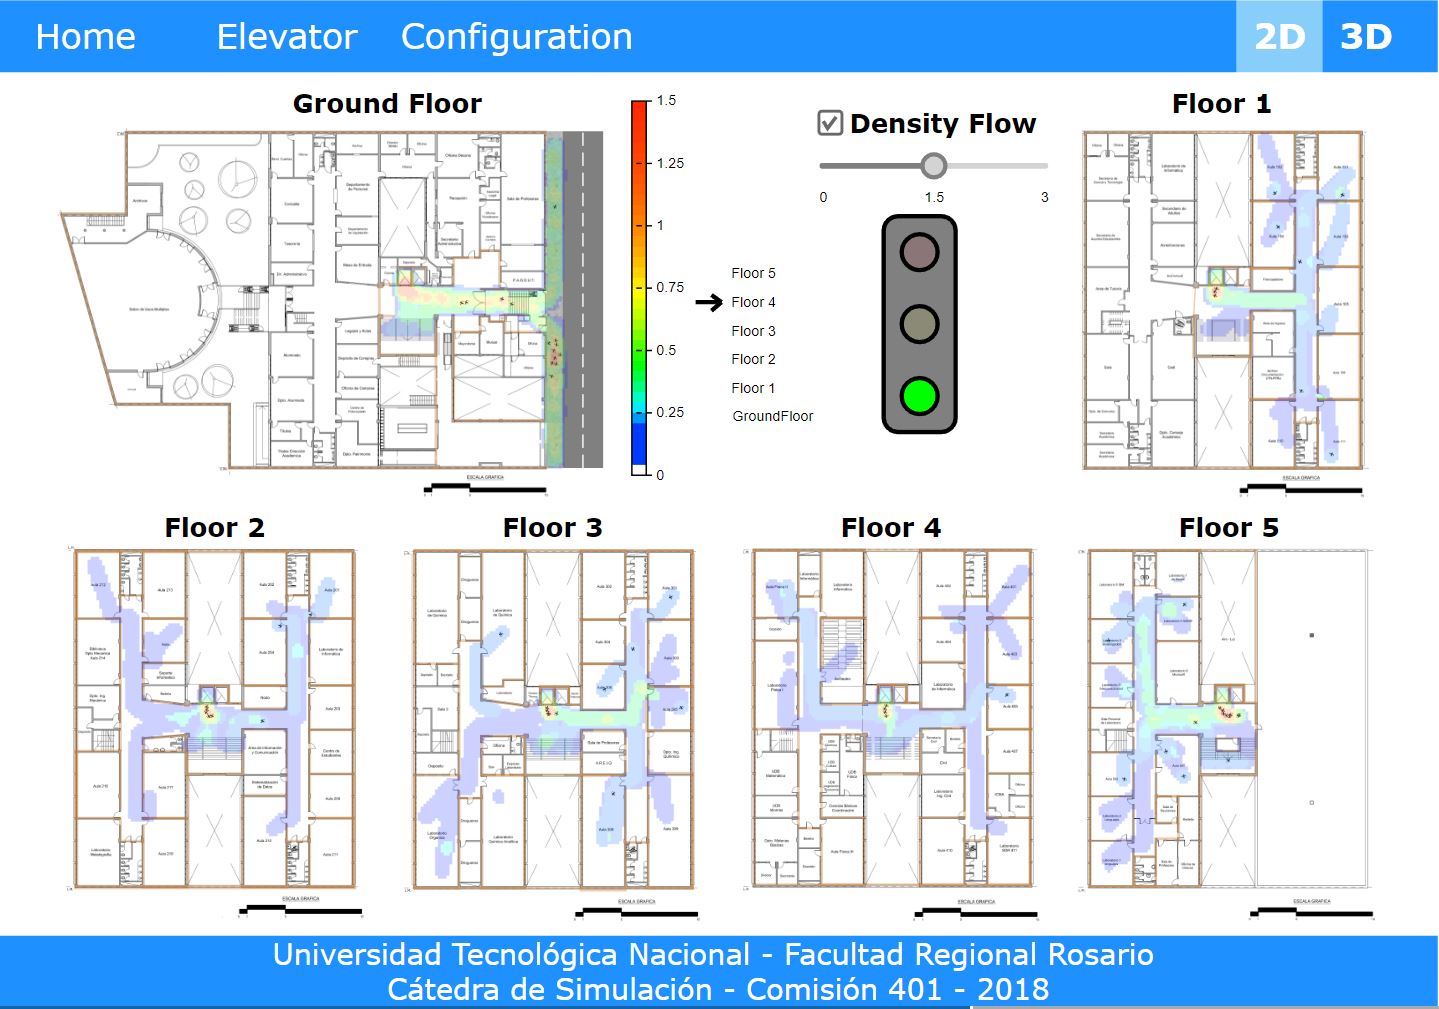
2D View
2D View with Flow Density
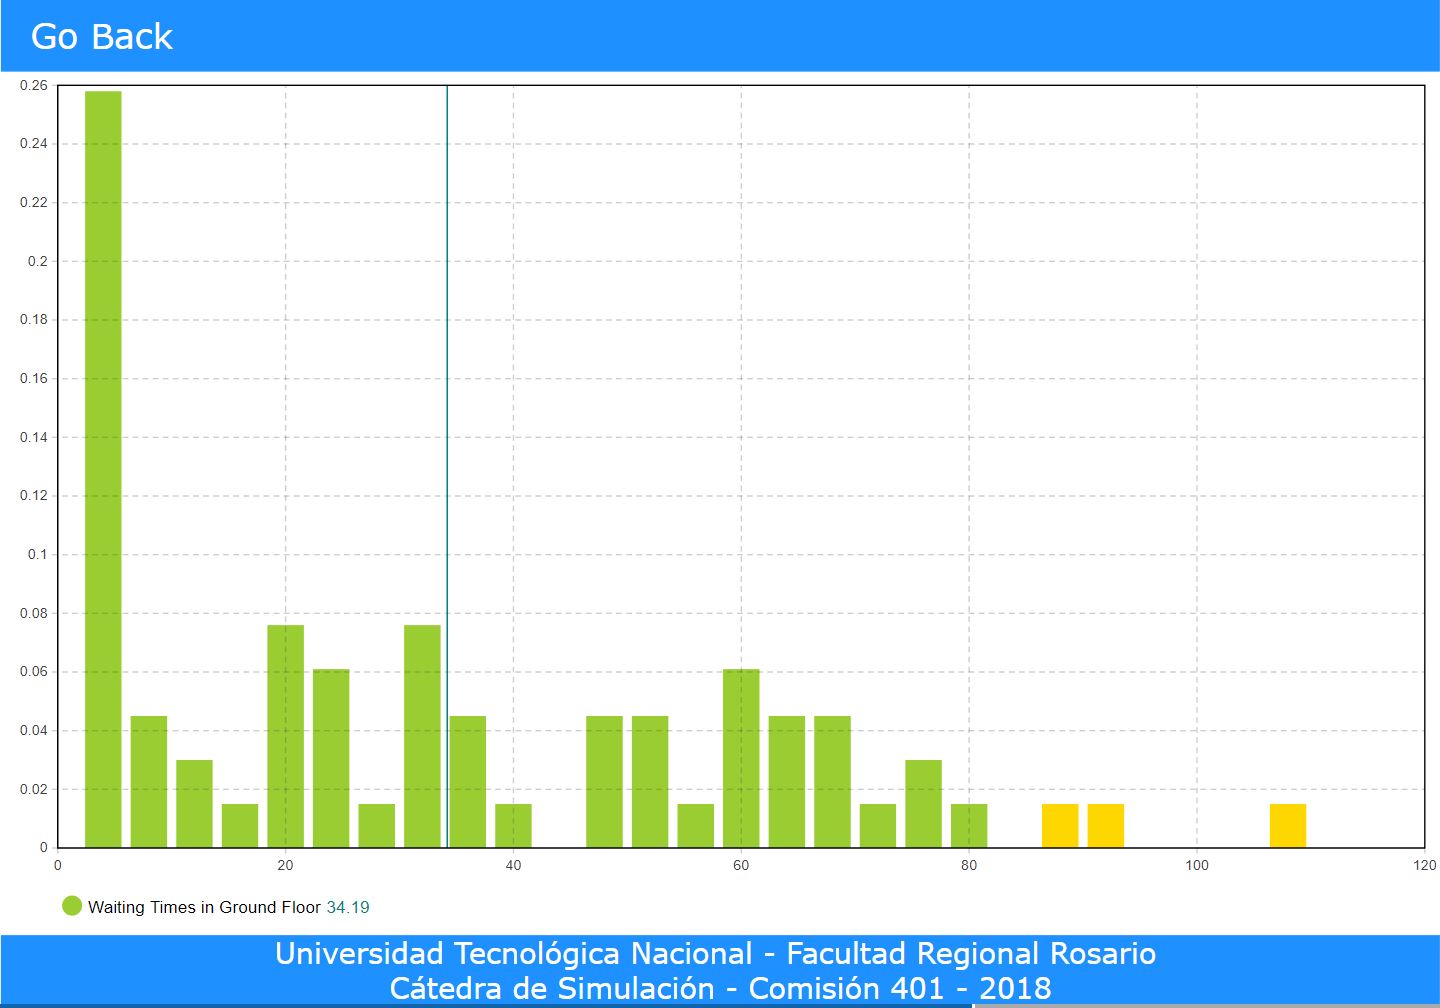
Waiting Time Histogram
Number of people vs Time (Multiple graphs)

Additional Resources
- AnyLogic Official Website: Here you can see the software features, case studies and examples.
- AnyLogic in Three Days: Modeling and Simulation Textbook: This was the book I used to learn the basics of the software although experimentation is also required to fully understand some topics.
- AnyLogic Cloud: This is the online repository of AnyLogic, where you can find several models from different topics. Free registration is required in order to see and run the models. Here is where the elevator simulation model is hosted.