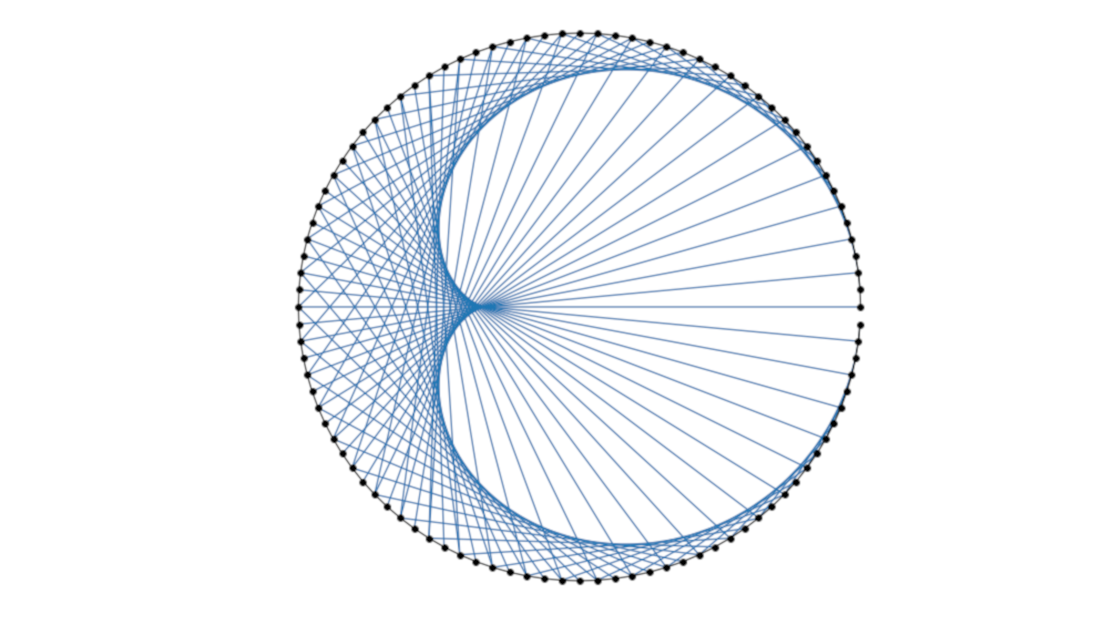
Explore the mesmerizing patterns of times tables with Python! In this blog post, we present an alternative implementation to the famous Mathologer's video where beautiful patterns emerge from times tables. Burkard highlights how stunning patterns arise from these tables and utilizes Wolfram Mathematica to demonstrate these patterns in greater detail. This blog post aims to showcase a similar implementation using Python.
Visualizing Math: A Guide to Creating Times Table Animations with Python